Eclipse debugging goodness

Debugging Java applications remotely can be extremely useful when the machine you are debugging on does not have access to the source, or when the application you would like to debug is run within a complex wrapper or framework (i.e. Maven).
If you ever wished to debug a Java application remotely using Eclipse, here is how you do it.
Start the Java application you want to debug with:
java -Xdebug -Xrunjdwp:transport=dt_socket,server=y,suspend=y,address=8000 Application
If you wish to debug a test run by the Maven surefire plugin, simply set:
MAVEN_OPTS=-Xdebug -Xrunjdwp:transport=dt_socket,server=y,suspend=y,address=8000 -Dmaven.surefire.debug
The -Xdebug option enables debugging support in the VM, while the -Xrunjdwp loads in-process debugging libraries and specifies the kind of connection to be made.
In the above example, we are specifying that the remote debugging session will use the dt_socket transport listening on port 8000. The suspend clause will cause the debugger to wait for a connection to be established before starting to run the application.
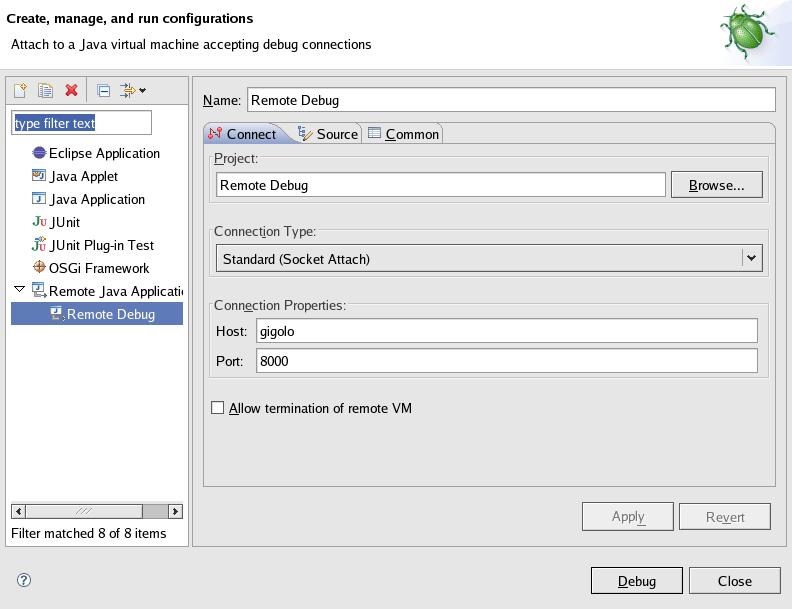
The next step is to configure a Remote Java Application debug target in Eclipse.
Click on Run menu, Open Debug Dialog...
Create a new Remote Java Application launch configuration, making sure that the port number in the Connection Properties section matches the address specified on the Java command line and that the hostname is set to the machine where your Java application is running.
Then click Debug. It's that easy.
- Matteo Vescovi's blog
- Login to post comments